P02 Measurement
How the HEMOX Analyzer works:
A tungsten halogen source, shines through a pair of collecting lenses focusing the primary beam on the center of the sample cavity. A beam splitter diverts 50% of the light to detector l, while the other 50% are falling upon detector 2. Before reaching their respective detectors, the light passes through narrow band monochromatic filters for proper wavelength selection. The two built in, removable filters, provide the best conditions for use with the HEMOX analyzer.
The oxygen concentration of an aqueous solution is very easily measured with an oxygen electrode. This method of measurement is not only accurate, but also reliable and reproducible. The HEMOX analyzer uses such an oxygen electrode for determining the oxygen concentration directly in the sample cavity where the absorbance is also being monitored.
Under normal conditions the oxygen concentration or, as it is commonly called, the oxygen partial pressure, under athmospheric conditions (sea level) of 760 mmHg, is 148 mmHg (sea level) for the sample in the cavity. This saturation point is used for full scale calibration of the recorder prior to starting the plotting of the curve.
When the oxygen is being replaced by an inert gas, as for for instance nitrogen, argon or helium, in a continous procedure, hemoglobin becomes deoxygenated according to the following equation: [HbO ] <----> Hb + O
The Hemox Analyzer can record both the association curve and dissociation curve. However you must always deoxygenate your sample first (Dissociation curve) before you can oxygenate your sample (Association Curve)
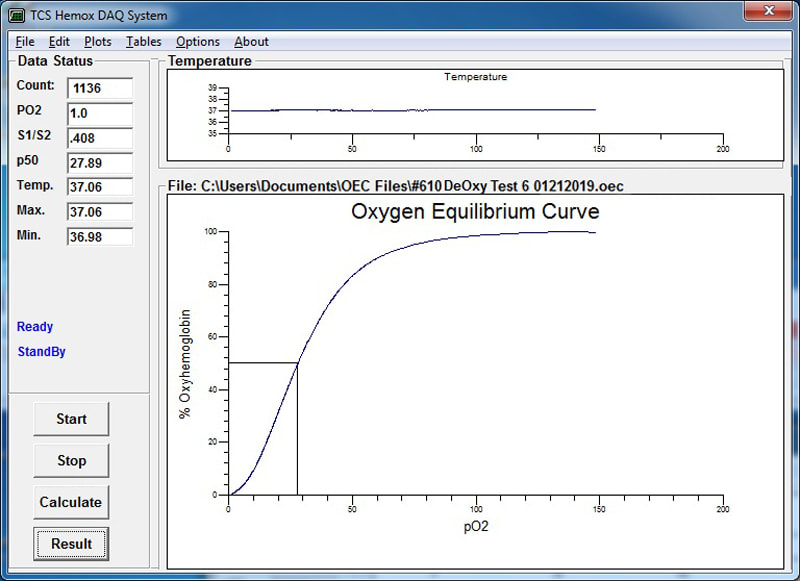
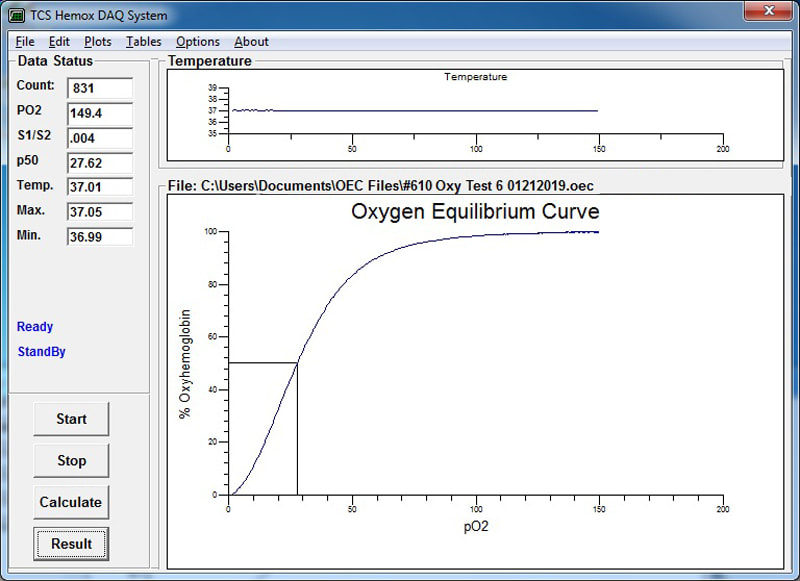
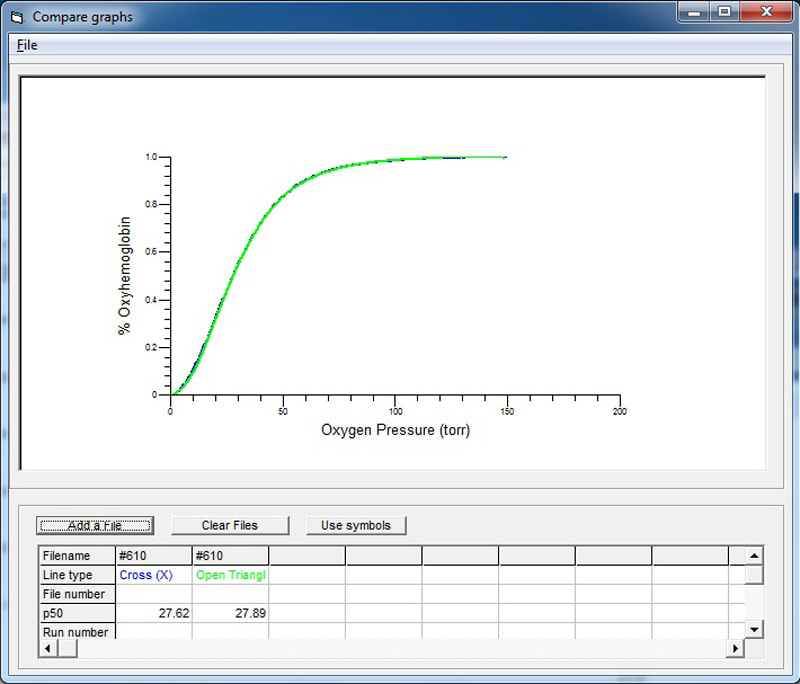
The figures below show both a typical Dissociation and Association curve of normal blood which was obtained with the HEMOX ANALYZER. The curve recording was started with the blood sample in a fully oxygenated state and a 148mmHg (Sea Level) (approximatly 7-10 mins Swiched to "AIR") and was then slowly deoxygenated after switching from "AIR" to "N2". When the PO2 reading is approx. 1.0 mm Hg, i.e. the oxygen partial pressure has reached almost zero, and the hemoglobin has been almost completely deoxygenated, the recording of the dissociation curve will automatically stop via the software and your curve is finished being plotted. In this example the run time was 1136 secs or a little over 18mins. To start the oxygenation curve, simply flip the gas selector switch from "N2" to the "AIR" position. The Association curve often finishes faster, in this example we see that our test finishes in just 831 secs or a little over 13 mins. In fresh, healthy, normal whole blood you should see very little difference between the Association and Dissociation Curve. In our example below we see a difference of only .27 between the two p50's. Furthermore we can look at the two curves in comparison to eachother and see visually that the curves overlap each other almost exactly.
The oxygen concentration of an aqueous solution is very easily measured with an oxygen electrode. This method of measurement is not only accurate, but also reliable and reproducible. The HEMOX analyzer uses such an oxygen electrode for determining the oxygen concentration directly in the sample cavity where the absorbance is also being monitored.
Under normal conditions the oxygen concentration or, as it is commonly called, the oxygen partial pressure, under athmospheric conditions (sea level) of 760 mmHg, is 148 mmHg (sea level) for the sample in the cavity. This saturation point is used for full scale calibration of the recorder prior to starting the plotting of the curve.
- The setting of the PO2 value on the digital meter and the computer depends mainly on the atmospheric pressure and the gas that is being used for oxygenation of the sample.
- When air is being used for oxygenation and the true barometric pressure is 760 mm Hg, the setting is derived as follows:
- P02 = (P atm- P w) x 0.209
- P02 = (760 - 47) x 0.209
- P02 = 713 x 0.209 = 149 mm Hg
When the oxygen is being replaced by an inert gas, as for for instance nitrogen, argon or helium, in a continous procedure, hemoglobin becomes deoxygenated according to the following equation: [HbO ] <----> Hb + O
The Hemox Analyzer can record both the association curve and dissociation curve. However you must always deoxygenate your sample first (Dissociation curve) before you can oxygenate your sample (Association Curve)
The figures below show both a typical Dissociation and Association curve of normal blood which was obtained with the HEMOX ANALYZER. The curve recording was started with the blood sample in a fully oxygenated state and a 148mmHg (Sea Level) (approximatly 7-10 mins Swiched to "AIR") and was then slowly deoxygenated after switching from "AIR" to "N2". When the PO2 reading is approx. 1.0 mm Hg, i.e. the oxygen partial pressure has reached almost zero, and the hemoglobin has been almost completely deoxygenated, the recording of the dissociation curve will automatically stop via the software and your curve is finished being plotted. In this example the run time was 1136 secs or a little over 18mins. To start the oxygenation curve, simply flip the gas selector switch from "N2" to the "AIR" position. The Association curve often finishes faster, in this example we see that our test finishes in just 831 secs or a little over 13 mins. In fresh, healthy, normal whole blood you should see very little difference between the Association and Dissociation Curve. In our example below we see a difference of only .27 between the two p50's. Furthermore we can look at the two curves in comparison to eachother and see visually that the curves overlap each other almost exactly.


